


Litigation Capital Management: Deep Dive
Part 1 - The Past

This is part 1 of a deep dive into LCM. We’ll take a look at how they make money but based on actual cash flows rather than accounting. How ROIC and IRR hold up based on these cash flows. Where the capital for the business is coming from. And what they are worth today, conservatively.
In Part 2, I’ll model future performance and come up with a discounted view of future cash flows.
I’m assuming you know something about LCM coming into this. If not, have a look through my previous write-up:

Let’s get going!
Revenue and Expenses
LCM makes money through settlements and awards received from the resolution of their direct investment in cases, and, more recently, through the fees earned on the funds they manage. These fund fees have not been material over the past 5 years, but they will become significant in the future. They have two main expenses:
Litigation Service Expenses: the capital they invest externally, which goes on solicitors, barristers, experts, court costs, etc. They don’t record expenses incurred by cases until they reach a settlement or award. Before that, they sit on the balance sheet as litigation assets. When the settlement is considered resolved, these fees are recorded as litigation service expenses on the accounting statements, similar to the cost of goods sold.
Operating Expenses: the day-to-day running of the business, including fund administration charges. These expenses are incurred in the current year against cases that may have settled in the current period but also for cases that are ongoing and have yet to settle.
So, the money they earn from successful litigation and fund fees needs to exceed the cost of funding cases and their operating expenses.
ROIC and IRR
In HY24 (p. 13), LCM reported an average IRR of 67.4% for the past 3 years. They also reported an average “Multiple of Invested Capital” (MOIC) of 3.03, which means they returned 3.03 x the original investment, or 203% ROIC. These sound quite astonishing, but don’t take these numbers at face value. They don’t factor in expenses, and in the case of MOIC or ROIC, time. We’ll do that later.
The other important aspect of ROIC is their ability to deploy additional capital. This is critical. A business that consistently generates a 25% ROIC is great, but a business that can also grow invested capital by 25% while returning a 25% ROIC is in a different league. I wrote a couple of articles on ROCE and the growth of capital deployed a short while ago:


LCM can grow capital deployed organically and by raising funds through their Global Alternative Returns (GAR) model, through which they earn fees. This is an incredibly important aspect of this business, as it is just starting to influence returns. They have gone from $0 in third-party funds to $441 million in 3 years. They are also planning to raise an additional $450 million in the future. So they are looking to manage almost $1 billion in third-party assets in the space of 5 or 6 years. That’s a huge leap in their ability to deploy additional capital.
Accounting Revenue vs Cash
Accounting profits are not the same as cash flows. There can be a delay in receiving the settlements or awards they recognise in any given year:
The majority of settlement balances are received shortly after the period end in which the litigation funding asset has concluded, and all settlement balances are generally expected to be received within 12 months after completion.
They also switched from cash to fair value accounting, which they’ve been talking about for over 5 years, but this market is highly illiquid, meaning fair value is largely judgement. LCM do employ what I believe to be a fairly conservative fair value model based on past performance (FY23, p.99). I preferred the cash accounting model, but I understand the switch, which helps smooth out some of the lumpiness in returns.
With that said, we’re going to follow the cash, which lags accounting settlements by up to 12 months and isn’t subject to the artificial smoothing of fair value. This should give us a very conservative picture of LCM and eliminate any cash flow worries we might have.
We’ll look at:
Cash Deployed: what leaves the business and is spent on litigation cases
Cash Received: what comes into the business - what they actually collect
Expenses: everything included in PBT, i.e., all expenses less taxes paid
Gross and Net Profit: what the real returns of this business might be, excluding taxes
Conservative Valuation: ignoring the future, what is LCM worth today
Luckily for us, they have a cash flow waterfall that they’ve been publishing for the last 5 years that makes this very easy to read:

Source: FY23 Investor Presentation
Cash Deployed: Investments in Cases

The large investments in 2020 and 2021 are due to Fund I, where they had to invest 25% alongside 75% of A$250 million of Fund capital (~$150 million USD) in addition to continuing to fund balance sheet cases.
Another aspect of cash deployed is total deployed capital over time. I’ve used the balance sheet contract costs, current and non-current, to arrive at a total deployed capital for the year. They do report total capital deployed, and it’s very close to the contract costs.
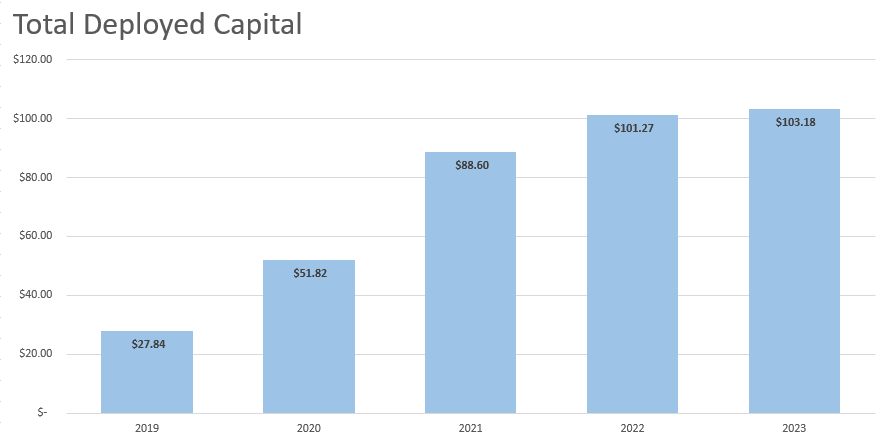
They flatlined a bit in 2023 due to the huge uptick in settlements, which we’ll show shortly. This is also why revenue appeared to flatline on a fair value basis. As they realise cash through settlements, this decreases the total deployed capital by the deployments on those realised investments. If they have a bumper year of settlements, then additional deployments made in the year probably won’t compensate for that.
Where Has the Cash Invested Come From?
Businesses often borrow to scale, either through equity or debt. A great business can then continue to scale through it’s own organic cash generation. Let’s look at where the cash they’ve invested has come from over time. Are they generating organic cash or still raising capital?

Note that I’ve included HY24 in these figures. FY24 is very likely to be higher.
So they stopped raising additional capital after 2023 and, in fact, paid down debt and even distributed A$5 million to shareholders, essentially repaying the raised equity. You can clearly see the gap developing between raising capital and deploying their own organic capital. Here it is more clearly stated:

They raised capital in 2019 that they also deployed in 2020. From 2021 onward, the error bars (the line above the blue bar) give you a feel for the organic capital they are deploying in an individual year. In HY24 I’ve included paying off debt and dividends as a reduction in capital raised. Here’s a better view of the net increase in organic capital:

They’ve transitioned from needing to raise additional capital in 2019/20 in order to invest alongside their GAR funds to generating enough organic cash to invest alongside the funds, pay a dividend, buy back shares, and repay some debt. Bear in mind that this cash generation was largely from direct balance sheet investments and not fund fees (yet!)
Cash Received: What They Collect

Cash received took a big boost in 2018, likely as a result of the capital raised from the ASX listing in 2016. They were a much smaller business before then, with ~A$0.5 million in revenue. Yes, that's a 101% CAGR in revenue growth over 7 years. I don’t expect that pace to continue!
COVID-19 slowed down the legal system, which led to a decline in 2022 and a big boost in cash received in 2023. They also started to benefit from Fund I deployments in 2023, with A$24.6 million in fees collected.
Gross Profit
They provide numbers for litigation service expenses in their accounts; this is essentially the “cost of goods sold," so we can use this to easily calculate gross profit. We’re going to use the cash received rather than reported accounting revenue to be extra cautious.

2021 and 2023 were great years. I suspect delays in settlement due to COVID-19 led to weaker results in 2022, which subsequently got pushed into 2023.
Bear in mind, again, that we’re looking at cash received in the business. While investment returns continue to grow, cash received will almost always be lower than accounting figures due to the lag in collection.
ROICs and IRRs
Gross profit is what they use to calculate IRRs and ROICs. Let’s take a look at these based on cash received.
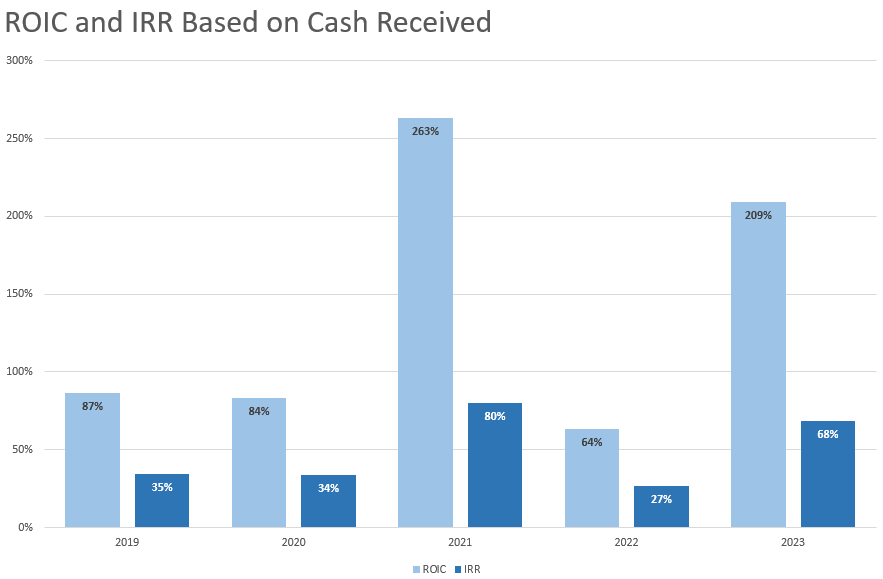
This is why they use averages over multiple years to calculate ROIC and IRR. They will vary, sometimes dramatically, from year to year. Averages over the past three years are 179% ROIC and 58% IRR. While these are below what they report (67.4% IRR 3-year average in HY24), they are calculated using cash received rather than accounting revenue. Even then, they are still very impressive!
IRR, as calculated here, assumes a linear deployment of capital over the average lifetimes of the underlying litigation. They report the following case duration average lifetimes over a rolling 3 year period:

They anticipate this average to increase toward 36 to 42 months, or 3 to 3.5 years, as case size increases due to the scale of capital deployed (people fight longer for larger amounts). Note that this doesn’t tend to affect their IRR as they factor time into their fees, i.e., they get paid more for longer duration cases.
Time Value of Money
Because litigation takes several years, we really need to discount these numbers back to day one to get a real view of the cost of investment and returns. As with IRR, we’ll assume linear deployment of capital. We’ll use 13% for the discount rate, which is harsh, but it’s the maximum they could pay on debt.

This is probably a conservative and very fair look at the returns generated on LCM investments. In reality, they are higher than this, for reasons already mentioned. But this gives you a solid margin for error.
The three year discounted average is 144% for ROIC and 46% for IRR, which are still very healthy numbers.
Expenses: The Costs of Running the Business
I’m going to include all expenses, less taxes, in my assessment of the costs of doing business. The main expenses of this business are:
Employee-related expenses: salaries, bonuses, benefits, etc.
Corporate expenses: leases, equipment, etc.
Fund administration fees: the cost of operating the funds
These three are grouped under "Expenses.”
Finance expenses: largely interest paid on outstanding debt
FX gains and losses: I’m including these as the theory is they average out so including them or excluding them shouldn’t make a difference. Let’s include them.
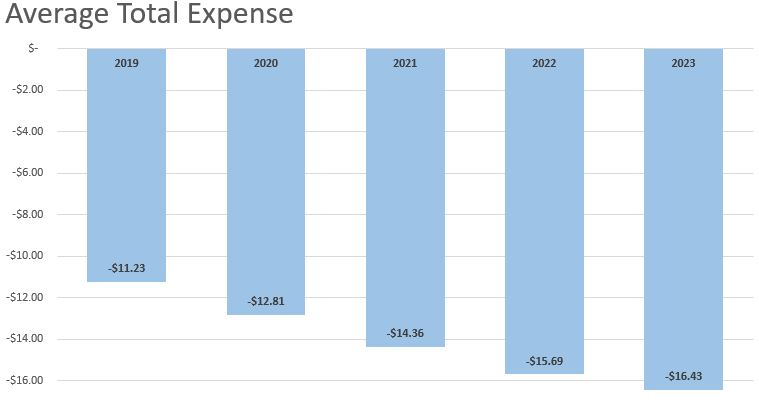
As I’ve used actual cash flows for my previous calculations, I’m going to use actual cash flows for expenses—what is really leaving the business in any one year. Over the past 5 years, there have been a few one-offs, like equity placement fees, but I don’t like to exclude these.

They’ve had a headwind from FX over the past 3 years. Prior to that, I doubt they had much cash flow outside of Australia. The core operating costs have remained fairly flat these past 3 years, which gives an interesting perspective on the cost of scaling this business (minimal). Paying off debt will free up net income, but they earn significantly more than the 13% maximum they could pay. Paying this down is irrational, but weighs on the psychology of potential investors, especially in this climate.
As investments don’t mature for around 3 years, expenses should be apportioned over the years based on an average. For instance, expenses incurred in 2023 should be partially allocated to 2024 and 2025. With this in mind, here is how I’ve apportioned expenses over the past 5 years:
Net Profit
Now that we have a view of gross profit and expenses, we can calculate net profit. Remember to keep in mind we’re being very conservative by following cash flows rather than accounting figures.


Profits from 2022 likely slipped into 2023 due to COVID-19. Perhaps averaging this out, we’d be looking at maybe A$18 million in 2022 and A$25 million in 2023. Now the business is starting to make sense. Fund I is only just starting to generate material gains for LCM. Fund II is yet to register. Throw in a Fund III and these numbers will accelerate dramatically. All that for a business you can buy today for around £95 million net of cash with assets of around £60 million at a conservative fair value.
What’s the Business Worth Today?
To work that out, let’s assume no new deployments of capital; they just run off what they’ve invested at an ROIC of 180%, which we calculated earlier. I realise that they have commitments that they need to continue to invest in, but for the sake of this exercise, we’ll assume they can just let them run to maturity.
They have A$108 million of capital deployed on investments as of HY24. This could generate A$263 million in three years at 180% + the return of deployed capital. We’ll ignore fund fees, which would have been a further multiplier; let’s be super conservative. We’ll assume they can operate at around 60% of current expenses, or A$9.6 million–A$28.8 million over three years. So that’s A$234.2 million net of expenses in year three. Now add in the cash on balance sheet at HY24, which was A$70.3 million. We have a final value in three years of A$304.5 million. Discount that back at 13% and you have A$210 million, or £110 million. With this super conservative valuation, they are trading at a very small premium today. Discounting back at a typical equity risk premium of 8% yields £127 million.
A more realistic analysis, taking into account further capital deployment and fund fees earned, yields about £227 million of present value at 13% or £260 million at 8% - a big discount to today’s price. Again, this valuation ignores any future potential of the business in the valuation, which could be worth significantly more.
So Why the Big Discount?
Small-cap: Successful fund managers almost always increase funds under management. It’s a waste of their time investigating businesses of this size. Have a look at You Can’t Beat the Market for more insight.
Unfamiliarity and Fund Restrictions: How do you model and forecast cash flows from litigation? It’s easier to stick with what you know or what’s permitted in your fund.
UK AIM listing. This is an overlooked and underinvested market globally.
Risks: There are greater risks involved in litigation, but I believe these are well managed by LCM. It’s almost impossible to assess the risk of individual cases for asset managers assessing investments. Liquidity risk: LCM will need to be conservative about how it manages cash flows, as they don’t want to be caught needing to raise balance sheet cash in difficult times to continue funding investments. There is also a marginal risk that LCM is the subject of litigation themselves.
Stigma: There is a negative stigma around this business model, no doubt exacerbated by the Muddy Waters reports into Burford. While Burford practices are indeed dubious, IMO, they have weathered this storm, improved transparency, and are generating some reasonable cash flows. By following cash flows in our assessment, we have also avoided the key aspects of the Muddy Waters investigation (asset valuation and accounting). FYI, Burford is not on my potential investment radar.
Regulation: Litigation finance is loosely regulated in some jurisdictions or entirely unregulated right now. It’s likely to come under increasing scrutiny over time, especially as the asset class grows. LCM maintain close relationships with regulators in their chosen jurisdictions.
Lumpy returns: They could have a year where far fewer cases reach an award or settlement, like 2022. We have a tendency to extrapolate out this randomness in returns and see a pattern that isn’t there. When we see a big dip, we think that’s the new normal and head for the hills. Humans also don’t do delayed gratification; they want to see a nice, smooth revenue and earnings chart increasing each quarter. That’s definitely not LCM, although scale and the fair value model will help smooth things out.
You have a small-cap stock with an unconventional profile that doesn’t fit most investors styles or experiences. Hence, you get mispricing. Even if investors don’t buy into LCM’s story, they will generate significant cash flows in 7 to 10 years and could easily end up paying a dividend in excess of their current market cap. Unless there are significant structural changes or disruptions to the litigation market, this is a very long-term core portfolio holding for me. I’m very likely to concentrate more of my portfolio in this business as time goes by.
Coming Up
In the next article, I’ll go into probable future performance where, conservatively, they could be generating around A$850million in cash from settlements and fees in 8 to 10 years. Discounting this back at an aggressive 13% gives you $250 million. At an 8% equity risk premium, that’s A$393 million. And at a 3% average inflation adjustment, it’s A$632 million. Keep in mind that this is cash generated from settlements. With potential margins as high as 50% to 85%, they could, in theory, pay a 65% dividend of A$205 million, or £108 million, adjusted for inflation. I don’t know too many businesses with that potential and risk profile when taking a conservative perspective. We’ll dig into this a bit deeper next time.